
Oceanographic work carried out by the Commission for the Geological Map of the World and UNESCO during the 1980s led to the publication of the completed Geological Map of the World in 1990, shown in conventional Mercator projection below. A legend for each of the colours depicted in this map is shown separately below. This geological map contains detailed geological information about the rocks making up both the continents and oceans and is used extensively in Expansion Tectonic small Earth modelling studies presented here.
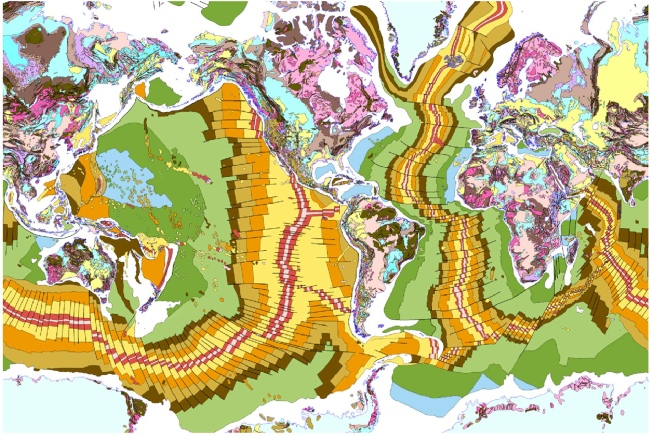
Geological Map of the World (digitised from the original Geological Map of the World map with permission from the Commission for the Geological Map of the World and UNESCO, 1990).
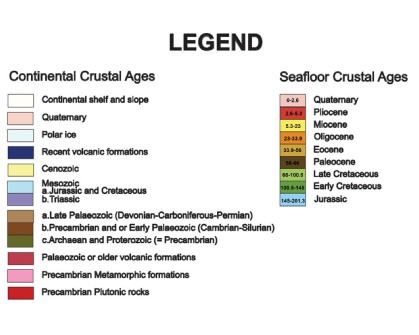
Geological timescale legend showing the various colours of the continental and seafloor crustal ages as shown in the Geological Map of the World. Seafloor crustal ages are in millions of years before the present-
In this geological map, the seafloor data gathering process has been extended to cover all of the oceans and magnetic striping evidence has also been taken a step further. By collecting samples of seafloor lava or sediment at regular intervals across the bottom of each of the oceans and dating their ages, these ages can then be used to date each of the magnetic stripes to produce a geological map. The coloured seafloor striping shown in theGeological Map of the World then represents age data displayed as set intervals of geological time.
What this mapped age dating evidence means is that the yellow seafloor stripes shown in the Geological Map of the World, for instance, located between the younger red stripes and the older orange stripes, represent volcanic lava that was progressively extruded along the ancient mid-
During Miocene times the younger red and pink lavas respectively did not exist—they were still retained within the mantle and hadn’t been extruded. This means that at that time the surface area of all of the oceans was smaller. It also means that the two adjoining yellow Miocene stripes were joined together and remained assembled along their common mid-
For each of the plates shown you will notice that the seafloor stripes, in general, surround and decrease in age away from the margins of the continents. A good analogy for what the coloured seafloor stripes shown in the Geological Map of the World represent is growth rings on a tree, where each surrounding seafloor stripe is similar to the growth rings on the tree. For most trees, a new growth ring is added around the outside perimeter of a trunk and branch for each year of growth. By moving back in time you must then remove each growth ring in turn. By counting the remaining rings you will also know how old the tree was and if you measure the diameter of each ring you will know how large the ancient tree was.
Similarly, the volcanic seafloor stripes shown on the Geological Map of the World can be visualised as representing the growth history of the Earth, where each stripe represents millions to tens of millions of years of seafloor crustal growth. By moving back in time each growth stripe must be removed in turn and the adjoining plates moved closer together. From an Expansion Tectonic perspective the surface areas of each of the coloured stripes can also be measured and from this an estimate of the ancient Earth radius can be made.
This basic understanding of seafloor stripes is fundamental to further discussions on the assemblage of continents and oceans on an Expansion Tectonic Earth back in time to the early-